The Digital Thread Reference Lab for Manufacturing
A torrent of technologies. A world of business problems. One connected product lifecycle.
Experience the future of connected product information.
A hands-on, vendor-neutral environment where manufacturing professionals, students, and educators can experience how connected product information turns into lifecycle intelligence, business value and better decisions.
Democratizing Product Development Information across Value Chain
Manufacturing organizations struggle with product information trapped in silos — fragmented across engineering, manufacturing, sales, supply chain, and field operations. Information access inefficiencies across enterprise applications prevent teams from making timely, data-driven decisions.
One Product. Dozens of Systems. No Single Source of Truth.
A single product record lives across PLM, PPM, ERP, MES, CRM, IIOT, Service & several others
Each system owns a slice of truth
No System owns the whole picture
The thread that connects them exists only in people's heads
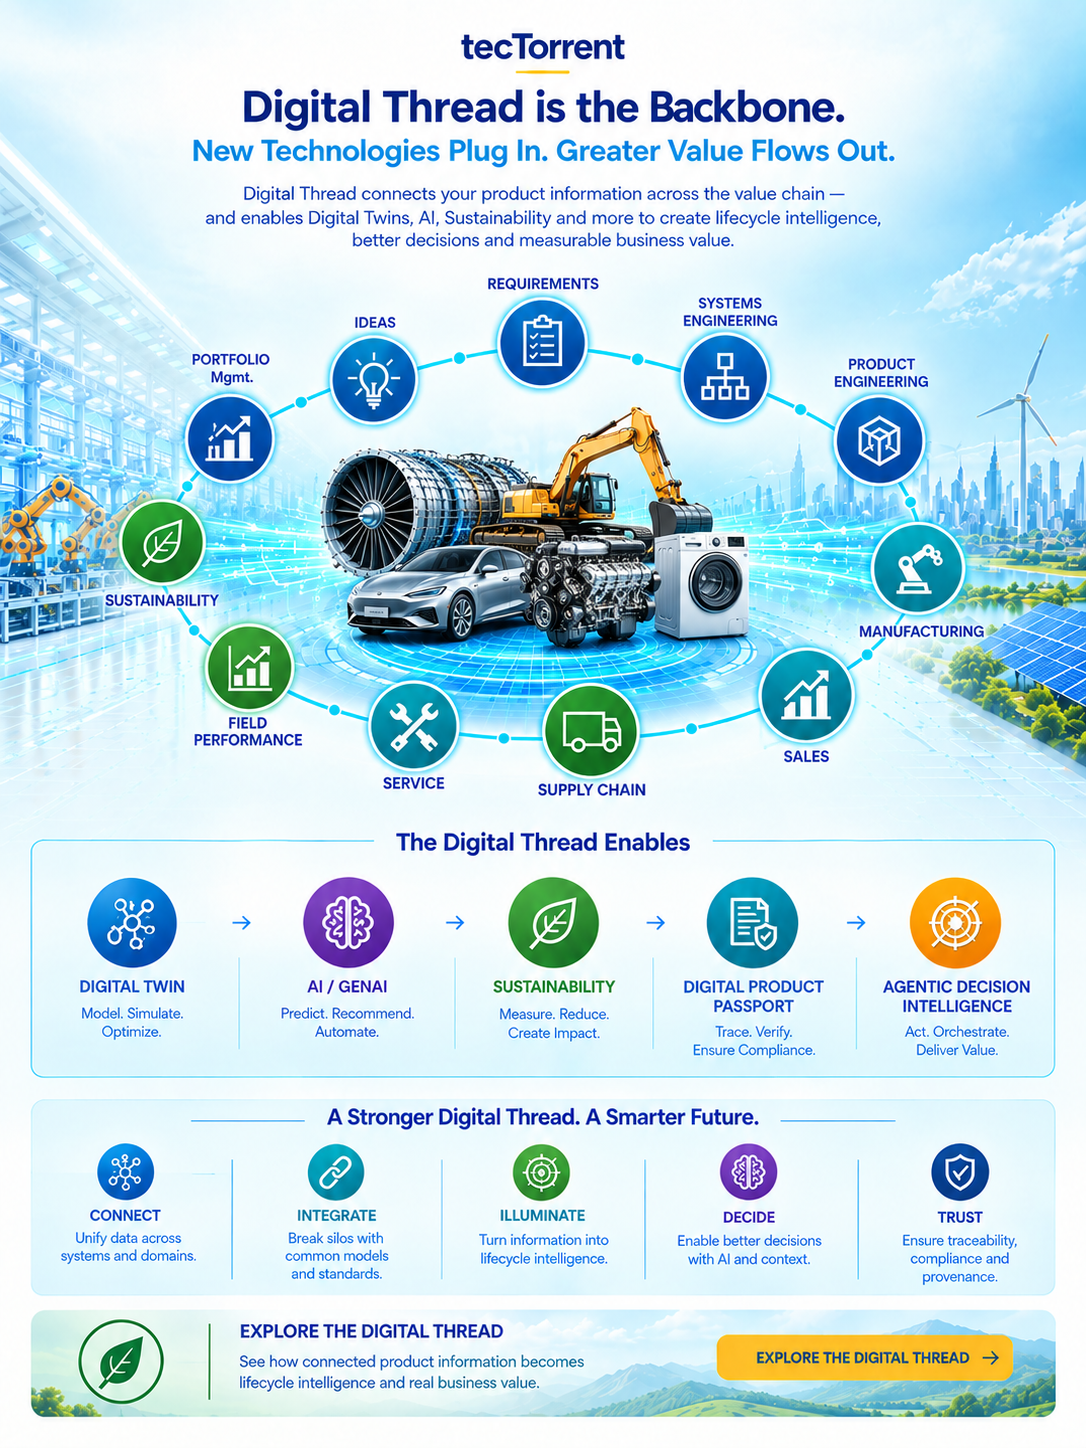
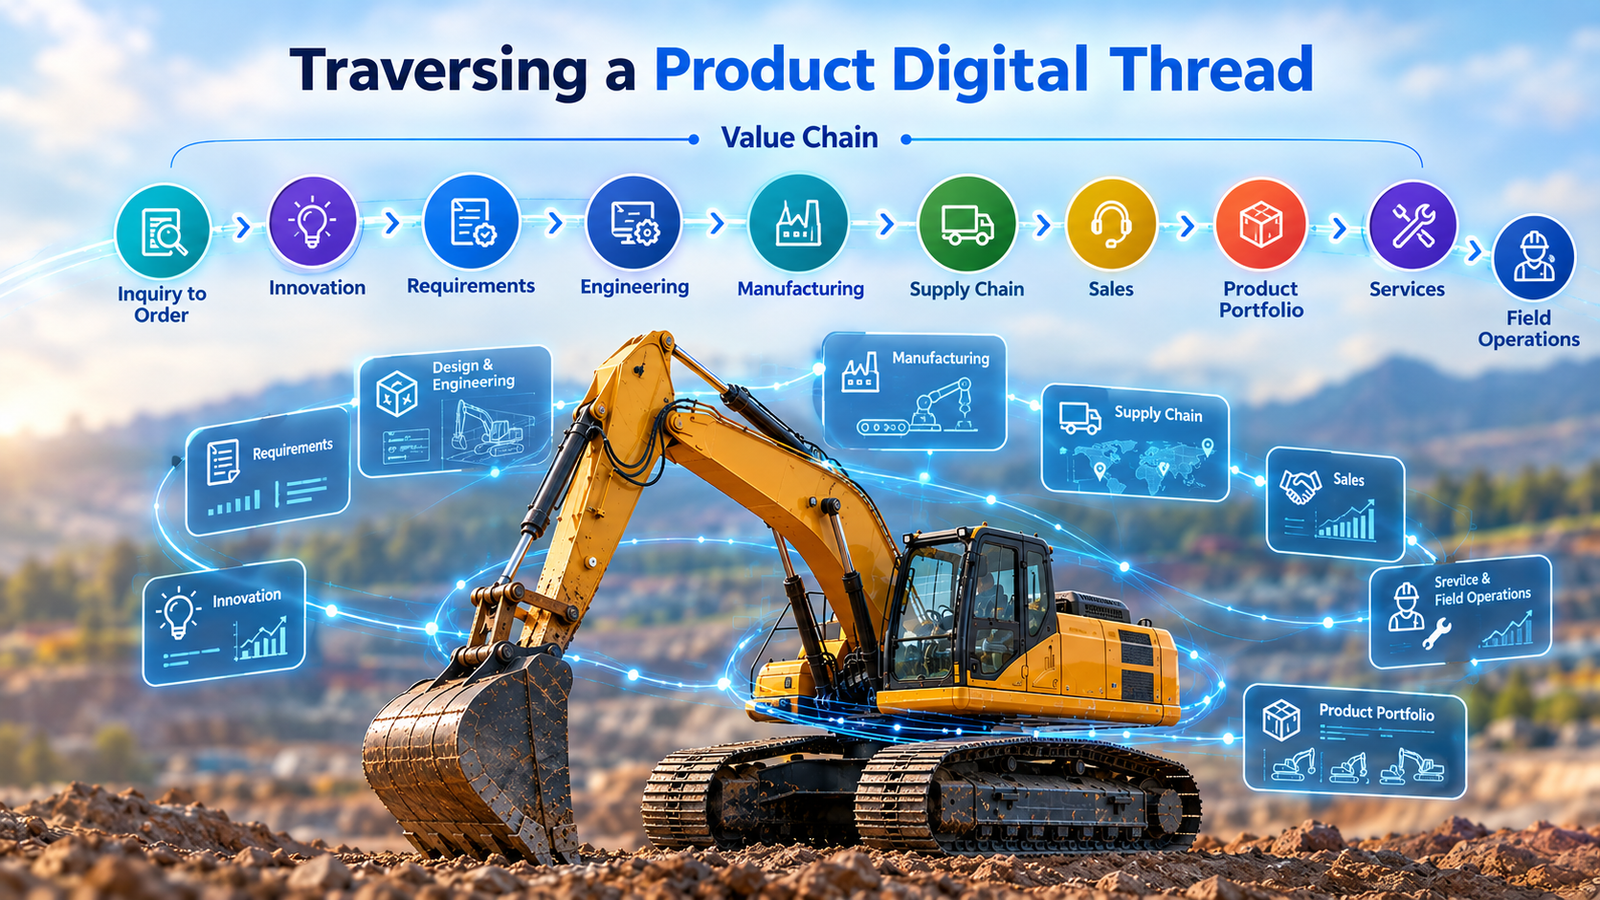
One traceable thread — idea to field performance, and back through the twins. | Digital Thread Information Model Leverages Data from Underlying System to create a Seamless End-to-End View
NewDigital Twins join the Thread: the Factory Twin shows the plant live, and the Field Asset Twin shows each machine at work. See how they work together →
Digital Thread · Connected Value Chain
From idea to field performance — all connected through AI-enabled intelligence.
One reference environment. Two clear starting points. Explore further whenever you're ready.
One Digital Thread, two Digital Twins
The Digital Thread says what should happen. The twins show what is happening, in the plant and in the field.
A Factory Twin reports how the plant is performing. A Field Asset Twin reports how each machine is behaving at work. Both talk to the same Digital Thread, so what is learned on the shop floor and in the field reaches the people who can act on it.
Digital Thread
The record of intent
One connected record of what the company has agreed to make and how.
Product options, released plans and engineering changes
Work orders and their progress
The as-built record of every machine
The loop between them
1A change or plan is released in the Thread
2The twins apply it: plant capacity recalculated, machines tracked against their design
3Plant results and machine alarms, condition and usage come back
4The Thread routes each item to Service, Engineering or both
5Accepted items change the plan or the design
Factory Twin
The live picture of the plant
OEE by station, line and plant
Capacity and bottlenecks, down to a single asset
Field Asset Twin
The live picture of the fleet
Health, alarms and usage per machine, on a fleet map
Feedback routed to Service and Engineering
One answerThe same work order and the same percentage on every screen.
TraceabilityFrom a machine back to the station, asset and plan version that built it.
Faster decisionsWhich line to fix first, and what it is worth to plant OEE.
Trustworthy commitmentsCapacity quoted from the shop floor, not a spreadsheet.
Field-to-design feedbackService and Engineering inboxes turn field signals into decisions.
Fleet visibilityFrom one machine to the whole map.
Illustrated with an earthmoving-equipment reference plant and a simulated fleet. Plant data, fleet data and 3D movement are simulated.
Delivering Connected Enterprise
From fragmented systems to intelligent, traceable digital threads.
Enable manufacturing organizations connect fragmented product information into intelligent, traceable
digital threads — from idea to field performance.
Digital Thread for Construction Equipment · Live View
Impact & What-if · ECN-1004
Track Chain hardness revision · simulated before release
Every operational signal priced — and traceable to its source
Potential
$17.9M
Gross opportunity pool
Addressable
$12.9M
72% of potential
Realized
$6.2M
48% of addressable
At Risk
$4.2M
Signals to address
🔧 Engineering changes → inventory exposure$5.7M
🏭 Quality → manufacturing rework$1.3M
📦 Supplier risk → delivery exposure$1.8M
🚜 Field issues → warranty / service$4.7M
Field → Engineering · SSL250
A single field signal travels back to design — closed loop
🚜
SC-005
Field signal High-flow delay
🔧
NCR-001
Root cause Attachment kit
📝
ECN · SW
Software fix Hydraulic response
✨
Next Gen
Production + fleet update
🧠 AI Advisor · Product Manager
Accelerate SSL250 high-flow software rollout to 14 serialized assets across 11 countries.
Prioritize dual-sourcing for the high-flow attachment kit to prevent recurrence.
AI Advisor · Role-based intelligence
Same underlying thread — a different, evidence-backed answer per role
🏢 COO
68%
Value-Chain Health · Caution 3 bottlenecks · 2 high-risk suppliers
📈 CCB
4
Changes ranked by impact 2 immediate · 1 non-compliant part
📦 Product Mgr.
2
Field-grounded AI recs Next-gen priorities
🧠 Current recommendations · based on field evidence
Accelerate SSL250 high-flow software rollout to 14 serialized assets.
Prioritize dual-sourcing for high-flow attachment kit.
Governance · Compliance trace
EXC-200-401-003 · Track chain service life ≥ 6,000 hours
Control
GOV-01
Machine Safety
Requirement
EXC-…-003
≥6,000 hrs
EBOM
Track Chain
600 mm shoes
MPM
OP-030
Undercarriage
Evidence
Pass
WO-3001
Asset
EMX220-24011
SW 4.2.1
Controlled
30
Compliant
26
At Risk
3
Gaps
1
Assets
14
Click any tab above — or watch it cycle through the five views | The numbers are illustrative & need to be worked out on case-by-case basis
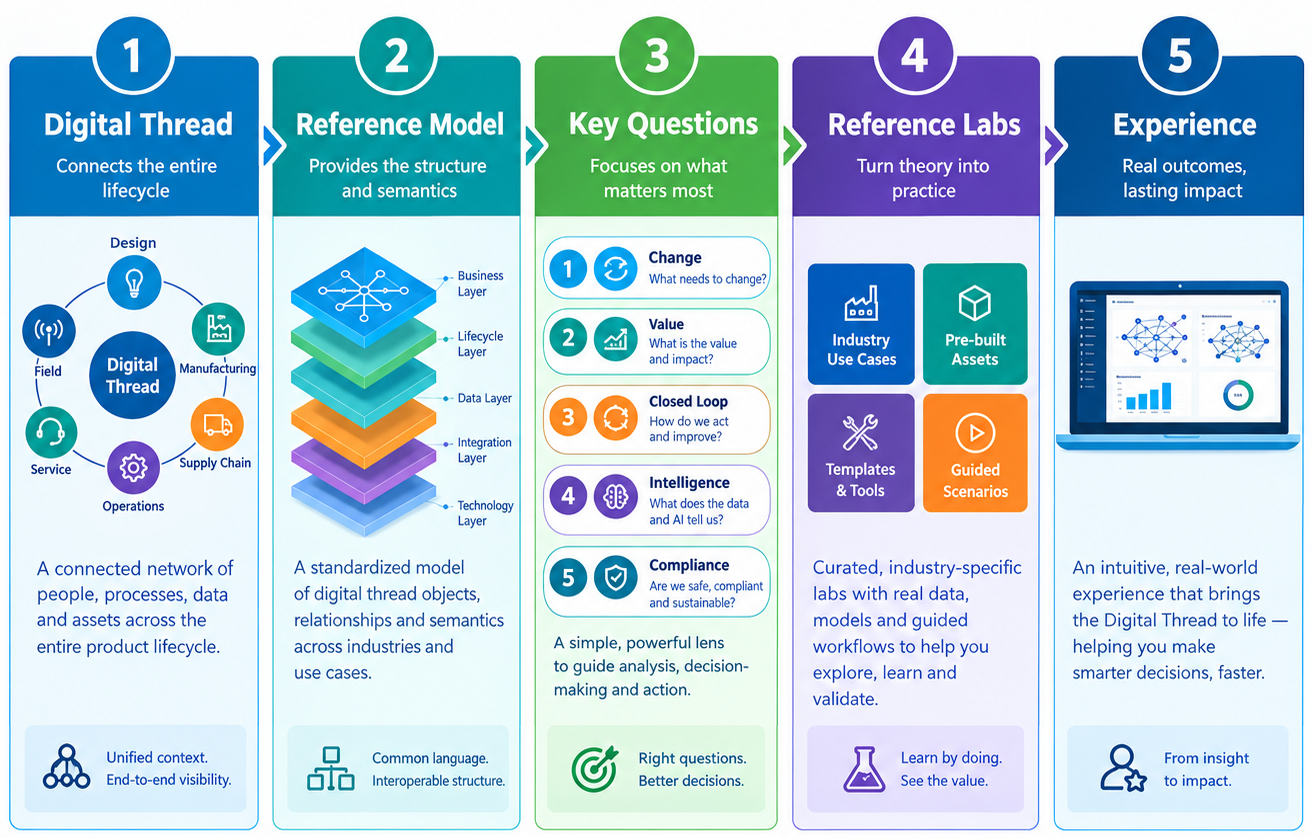
Digital Thread Information Model
Conceptual hierarchy of the Digital Thread information model.
Connected data to real-world impact — a structured journey from the
Digital Thread foundation, through connected intelligence, to the decisions and
experiences it enables across the value chain.
Each layer builds on the one beneath it — data, model, thread, intelligence and impact.
We make digital thread literacy a first-priority of every value chain induction.
tecTorrent is a mission-driven initiative built on decades of hands-on industry experience with focus on knowledge dissemination, mentoring, advisory & academic — create learning experiences that enables exploration of how real manufacturing organizations connect product information across the value chain.
Our Vision
A world where manufacturing enterprises benefit from ecosystem & workforce fluent in digital thread.
We envision a future where students, educators, and professionals
are not just aware of PLM, BOM, and lifecycle data — but have actually touched a
connected thread. A world where the classroom and the factory floor speak the same
language, and where the gap between academic theory and industry practice closes through
hands-on knowledge resources and practice, not slideware.
Our Mission
To democratize digital thread learning — making industry-grade product lifecycle context accessible to anyone, anywhere.
We do this by building digital thread sandboxes, guided scenarios, and knowledge resources
that mirror how real manufacturing organizations use digital threads. Most of what we create is
designed to be hands-on, curriculum-friendly, and accessible, so all can explore the same connected product record.
Why We Started
Built from the gap between industry practice and academic curriculum.
After more than two decades delivering PLM, digital thread, and Industry 4.0 programs
for global manufacturing organizations, we kept encountering the same pattern:
bright, capable professionals & graduates entering the workforce have almost no hands-on
exposure to how product information actually flows through an enterprise.
Even seasoned professionals struggle to conceptualize a Digital Thread. The tools were available in industry; the learning experiences were not.
tecTorrent was founded to close that gap. We package decades of real-world
information model, datasets, and scenarios into a form that audience can adopt
immediately — integration, and configuration overhead
that has historically made enterprise software inaccessible to classrooms.
Our commitment is simple: the learning experience stays central.
As the platform grows, its academic assets core remains free and its industry engagement
remains a means.
I built tecTorrent because I wanted the next generation of practitioners & engineers to touch
a real digital thread before they walked into their first engineering review —
not after.
Each is a pre-built, industry-tailored Digital Thread, kept true to the plant and the machine by Digital Twins — reducing time-to-value from months to weeks.
Click a card with a video badge to watch an overview. Live Reference Build means a runnable reference environment with illustrative data; Blueprint means the thread design is defined and the build is in progress. Factory Twin and Field Asset Twin mark the industries where those twins already work with the thread.
Watch video
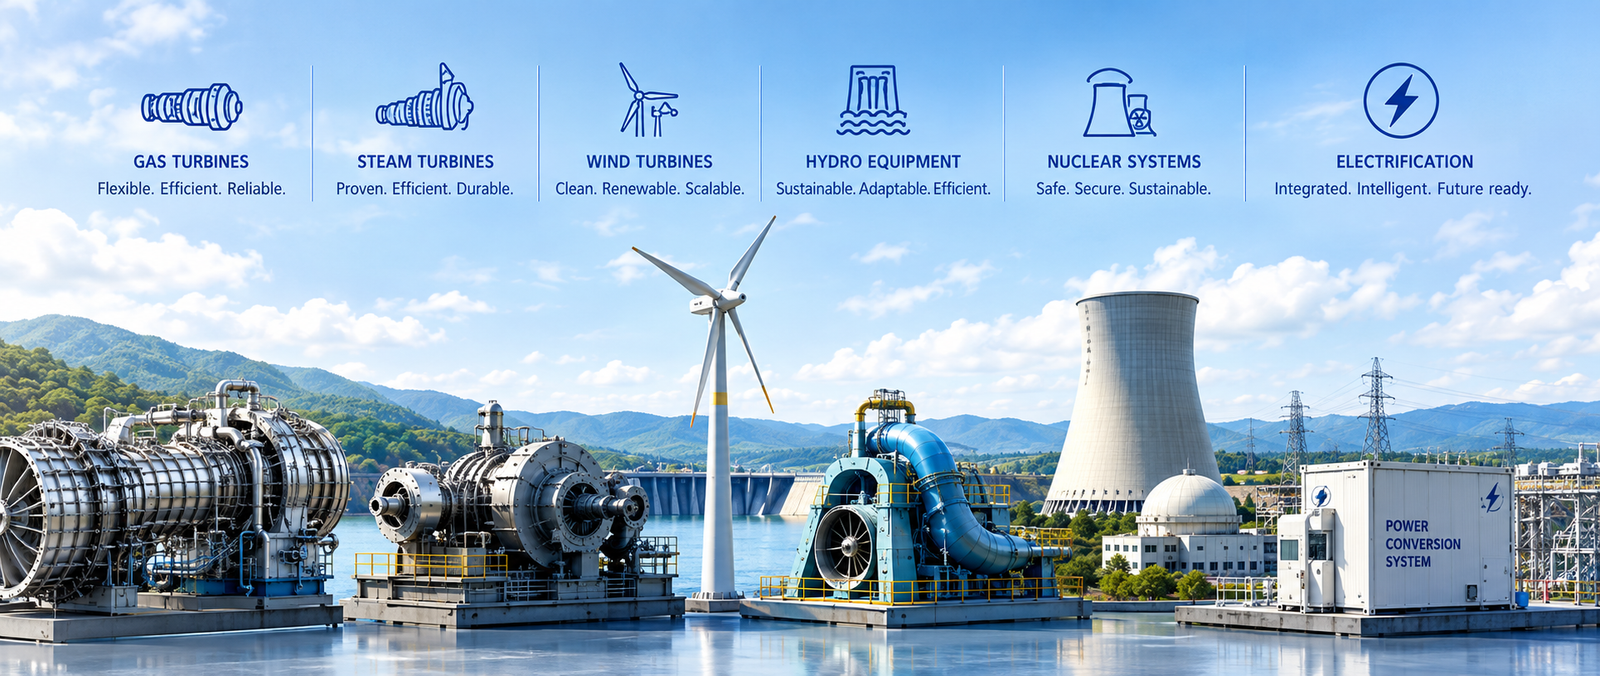
Power Generation Equipment
Gas turbines, steam turbines, wind, hydro, nuclear — connect engineering to field performance.
See it running
Requirement to EBOM steam turbine structure, parts and complianceRequirements tree from top-level need to componentProduct family and carbon units in operation and footprint by segment
Fragmented data silos from design to field make turbine failure analysis a slow, manual detective exercise, while regulatory pressure demands carbon transparency that scattered systems cannot deliver.
Snippets of how the digital thread answers
An industry-specific Digital Thread connecting requirements, systems engineering, product structures, manufacturing processes, supplier transactions, installation, service and asset data into one navigable lifecycle view. Engineers can trace a turbine or generator from its requirement through EBOM, MBOM, manufacturing work orders, quality evidence and installation to the asset in operation. Governance views connect requirements, compliance status, evidence, asset coverage and changes, providing perspectives for engineering, manufacturing, operations, service and compliance teams. Impact & What-if analysis traverses affected requirements, products, manufacturing, supply chain, customer orders and field assets to assess consequences before an engineering or maintenance change is implemented.
Live Reference Build
Asset Passport
LTSA service agreements
Fleet reliability & MTBF
Performance uplift
Compliance trace
Bid won / lost
Value drivers & leakage
Interface & KPP scorecard
What you can try
Requirement to asset: trace a requirement through EBOM, manufacturing process and quality evidence to the installed assets, with any engineering change that touches it.
Contract vs reality: see each LTSA's availability guarantee and burn rate beside fleet MTBF against its target, linked to the same requirement.
Change before you release it: pick an engineering change or problem report, see the requirements, work orders, suppliers, customer orders and installed turbines it touches, then compare Implement Now, Consume Inventory and New Production Only in dollars.
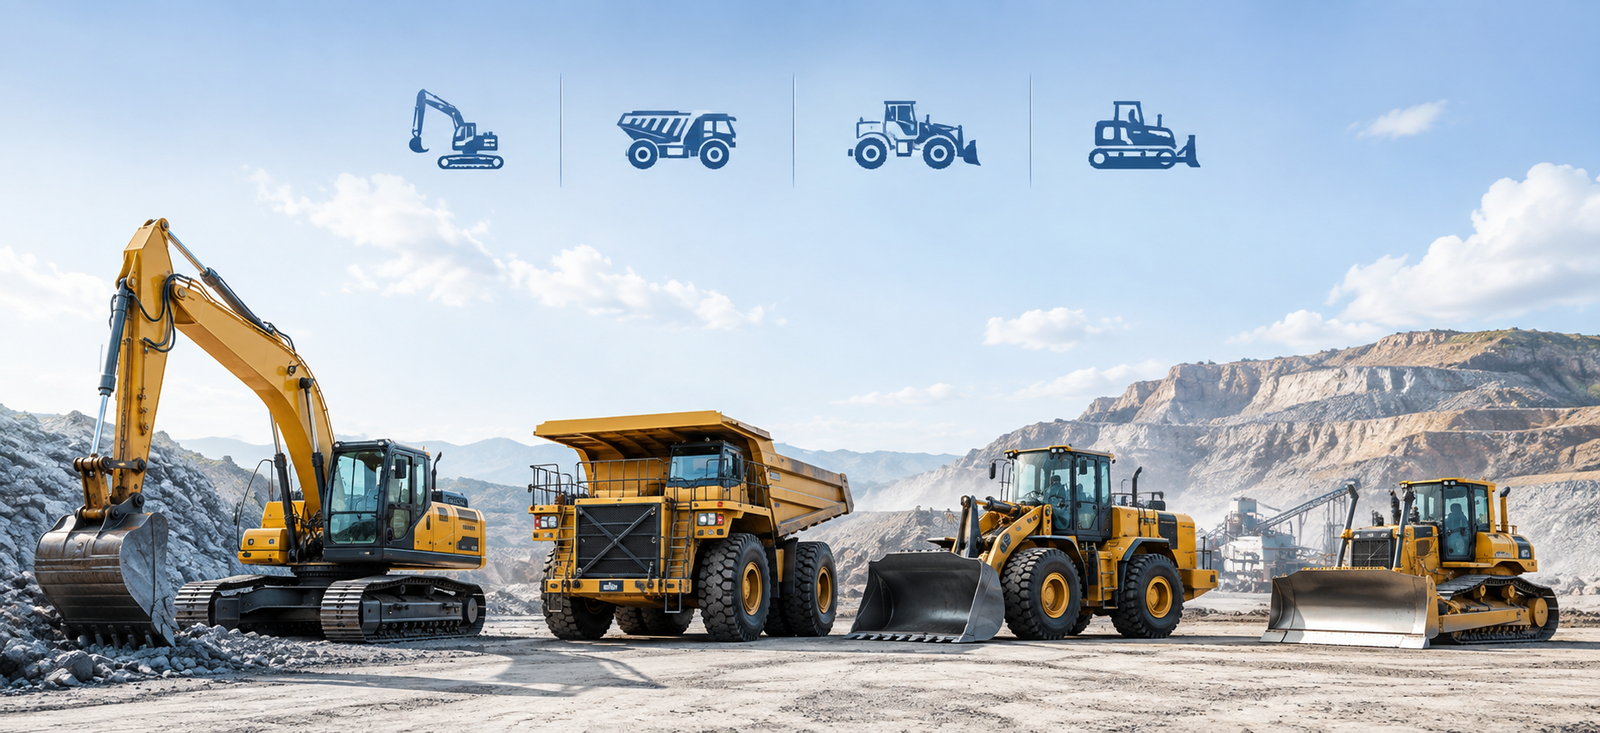
Construction, mining, agricultural machinery — manage complexity and global manufacturing.
See it running
Field-to-Design Loop fault code to design cause, ECN and every machineFactory Twin plant layout, OEE and line capability3D part model opened from the engineering BOM
Thousands of variants, global production sites, and a fragmented supplier network mean engineering changes take months to reach the factory floor—and quality issues are nearly impossible to trace back to their source.
Snippets of how the digital thread answers
Connected Digital Thread linking product configurations and variants with requirements, EBOM, MBOM, manufacturing processes, suppliers, work orders, customer orders and serialized machines. As models, options, regions and customer-specific configurations evolve, their engineering and manufacturing relationships remain traceable across the lifecycle. Engineering changes can be analyzed through the thread to identify affected requirements, parts, manufacturing operations, work orders, suppliers, customer orders and installed assets, while What-if scenarios assess inventory, production, supply, retrofit and customer exposure before release. Serialized asset and service records extend this traceability into the field, enabling quality and service teams to investigate machine history without manual reconciliation across disconnected systems. A Factory Twin reports build steps, operation status, line capability and plant performance. A Field Asset Twin reports faults, alarms, telemetry summaries, usage, software, location and parts replaced. Both exchange messages with the Digital Thread, which checks them against the product, the process plan and the as-built record. A fault seen on one machine runs back to its design cause, the engineering change and the requirement, then forward to every machine carrying the same part revision. What the field learns flows back to design, and what design changes flows out to the plant and the machines.
Live Reference BuildFactory TwinField Asset Twin
Configure to order
Serial effectivity
Machine records & as-built
Signals & triage
Field-to-design loop
Impact & what-if
Value cockpit
Role-based AI Advisor
Factory Twin link
Field Asset Twin link
Service & Engineering inboxes
What you can try
Change a part: release ECN and see work orders, purchase orders, customers and machines it touches.
Field fault to design: raise a hydraulic overheating on one machine in the Field Asset Twin. Follow it into the Service Inbox, then to the Engineering Inbox and the Field-to-Design Loop.
Plant gap: see where the Factory Twin's measured line capability falls short of what the design assumes.
Same part, other machines: find every machine fitted with the same part revision, with the warranty exposure and the supplier recovery.
Prove compliance: pick a requirement and see its evidence chain down to the serial number.
Connected fleet and OTA VIN-level software status and campaignsEBOM, MBOM, S/W BOM one vehicle line, every structureRequirements by platform linked to verification
Functional safety, variant complexity, and OTA updates require a unified digital thread—but disconnected ECUs, suppliers, and software versions make it impossible to trace a feature from requirements to field performance.
Snippets of how the digital thread answers
Create a connected, auditable Digital Thread linking requirements and system functions to hardware, software, manufacturing, suppliers, changes and deployed vehicles. Requirements trace through Systems Engineering, EBOM, MBOM, MPM and S/W BOM, with verification evidence and Engineering Change Notices maintaining configuration and compliance context. Supplier and production information connects components to their manufacturing and consumption points, while the Connected Fleet provides VIN-level software and firmware status and OTA deployment views. Role-based views expose the same thread through engineering, governance, manufacturing, service and fleet perspectives. Impact & What-if analysis then traverses these relationships to assess production, supply, customer and field consequences before change implementation.
Live Reference Build
E/E architecture
Software BOM
Connected fleet (VIN)
OTA deployment
Functional safety (ISO 26262)
Order-to-delivery
Plant map
Services & warranty
What you can try
OTA fix: follow a software requirement through its ECN to the OTA campaign: models, fleet size, rollout progress, success and rollback rates.
Safety trace: follow an ASIL D requirement through EBOM, build process and test evidence to the VINs in the field, with its software chain traced separately.
Battery change: select a battery-management ECN and see affected parts, work orders, purchase orders, suppliers, customer orders and fleet VINs, then compare three transition scenarios.
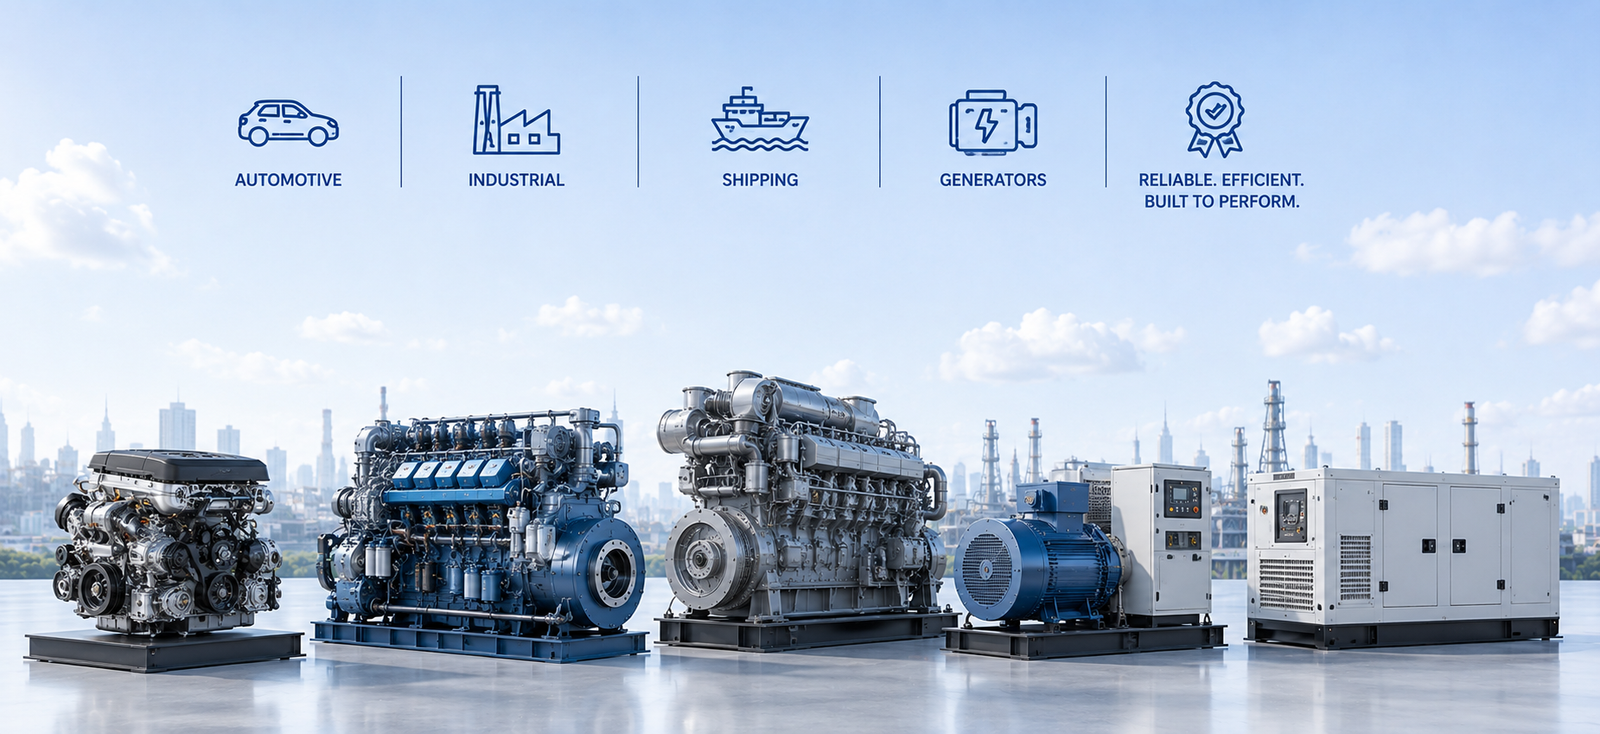
Diesel, gas and dual-fuel engines, generator sets, power packs, hybrid and hydrogen-ready systems — from requirements and emissions certification to field data.
Emissions rules differ by market and tier, calibrations and software baselines multiply, and every engine family has dozens of ratings, fuels and genset configurations. Certification evidence, test-cell data, production builds and field telemetry sit apart, so a calibration change or a failing component takes weeks to scope.
Snippets of how the digital thread answers
Requirements, engine and genset structures (EBOM, MBOM, SBOM and calibration sets), test-cell results, emission certificates, production builds and serial-level field telemetry are connected into one traceable thread. Compliance teams retrieve the exact evidence package for any regulation, market or serial number. Service and reliability teams feed field findings — injector wear, turbocharger failures, aftertreatment faults — back to engineering through a structured loop. Impact & What-if analysis shows how a design, calibration or software change spreads across ratings, markets and installed units, and prices the retrofit, warranty and certification effort before release.
Blueprint
Emissions certification (EPA Tier 4, EU Stage V, CPCB IV+)
Calibration & ECU software baselines
Rating / fuel / genset configurator
Test-cell to field linkage
Aftertreatment & DEF health
Serial effectivity & retrofit
Parts, service & uptime contracts
Hydrogen & biofuel readiness
Product carbon footprint
What you can try
Calibration change: adjust an injection map and see affected ratings, certificates, markets and serials.
Evidence pack: pick a market and serial and get the compliance chain from requirement to test to unit.
Field pattern: trace a repeated turbocharger alarm to a build lot and supplier, then open an engineering change.
Fuel options: compare diesel, HVO and hydrogen blends for cost, carbon and compliance.
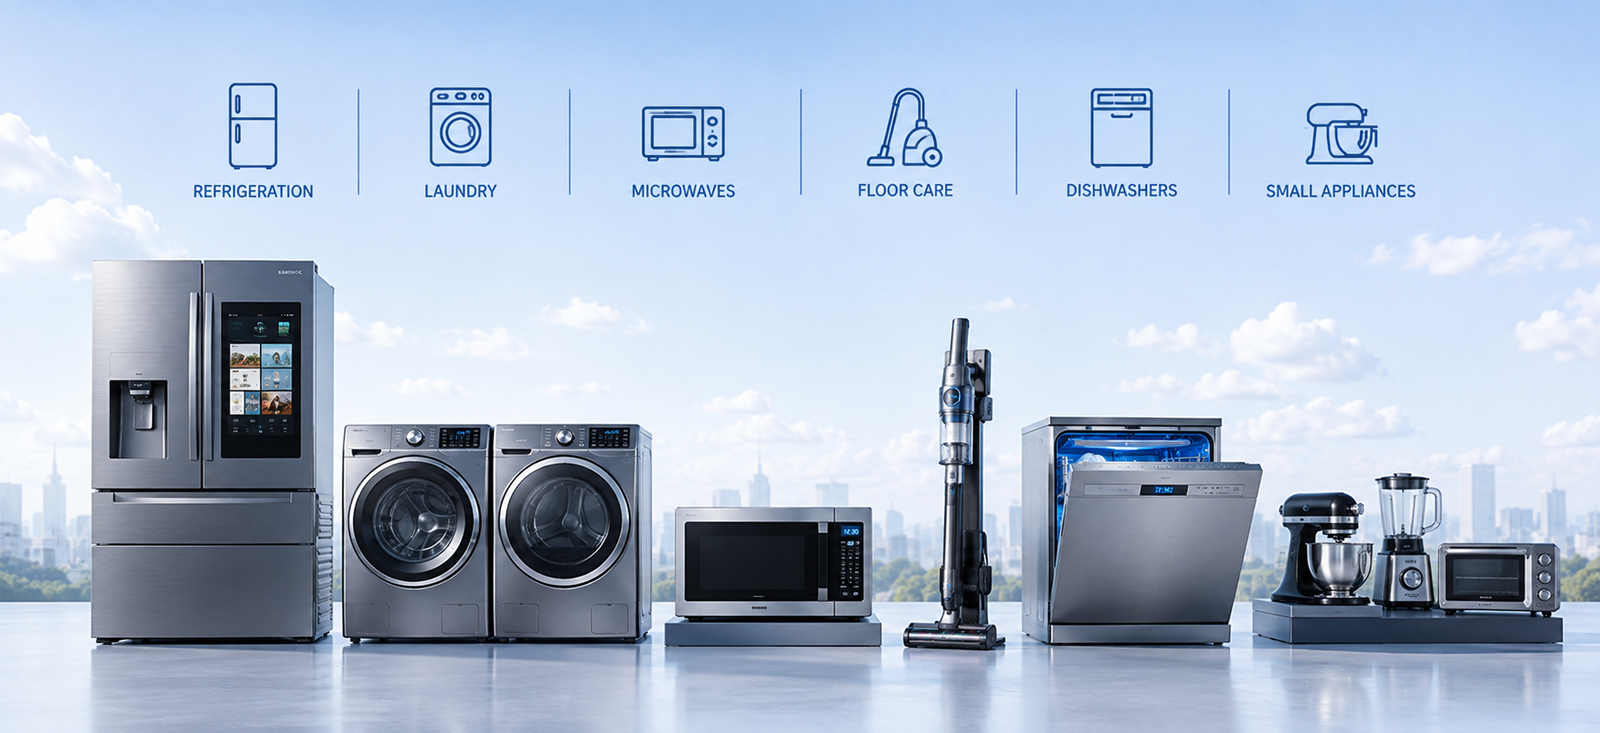
Appliances, electronics, furniture — managing product complexity, compliance, and customer satisfaction across global markets.
See it running
Claims to design: triage supplier lot, firmware or model design, with evidenceForecast to build demand, capacity and material alertsImpact and what-if cost, carbon and time of a change
Rapid product refreshes, global supply chain complexity, and sustainability regulations demand a seamless product information thread—but disconnected systems turn every model change into a data reconciliation nightmare.
Snippets of how the digital thread answers
A reusable product information framework keeps design, sourcing, manufacturing, packaging, and post-sale data aligned across every SKU, market, and refresh cycle. Each model carries its compliance and sustainability attributes from concept to customer without manual reconciliation. Role-based dashboards serve product, supply chain, and marketing teams from the same thread, while Impact and What-if analysis quantifies the cost, compliance, and time-to-market effect of any design or sourcing change before it is committed.
Live Reference Build
Forecast to build
Recall scope by lot
RoHS / REACH traffic lights
Per-unit carbon
Alternate-part what-if
MPM lanes & critical path
Supplier risk
Field-to-design loop
What you can try
Recall by lot: start from a supplier lot and list units, models, regions and channels.
Swap a part: choose an alternate and see cost, weight, carbon and compliance move through the BOM.
Seasonal build: compare forecast with capacity, stock and certification alerts.
Soft drinks, juices and other drinks — from formula to shelf, lot by lot, with packaging and co-packers.
See it running
Digital Thread: systems to outcomes PLM, ERP, MES, SCADA, WMS and QMS feeding one threadRecall and trace one lot to batches, pallets and customersRegulatory matrix US, EU and India label and claim gaps
Hundreds of SKUs, seasonal and promotional packs, short shelf life and recall exposure meet formulas, packaging, co-packers and cold-chain data held in separate systems. When a flavour, ingredient or label changes, nobody can quickly say which lots, lines, retailers and markets are touched.
Snippets of how the digital thread answers
One connected record from brand and formulation through recipe (formula BOM), packaging BOM, bottling and canning lines, batch and lot genealogy, distribution and the retail shelf. Trace any consumer complaint or quality hold back to the ingredient lot, tank, filler and shift, and forward to every pallet, customer and market. Regulatory attributes — allergens, nutrition labelling, sugar-tax bands, deposit and recycled-content rules, EPR/PPWR packaging data — travel with each SKU. Impact & What-if analysis prices a recipe change, a supplier failure or a packaging switch against stock, line capacity, promotions and service levels before it is released.
Live Reference Build
Formula & packaging BOM
Batch / lot genealogy
Recall scope in minutes
Allergen & label compliance
Packaging & EPR data
Line OEE & changeovers
Shelf life & cold chain
Regulatory matrix (FDA, EU, FSSAI)
AI Advisor by role
Supplier & plant what-if
What you can try
Mock recall: start from one lot or complaint, trace forward to pallets and customers, or backward to ingredients.
Supplier slips: pick a supplier, material or plant and see the SKUs, customers and revenue it touches.
Label check: run the regulatory matrix for the US, EU or India and see the gaps to close.
AI Advisor: ask by role, with a live or simulated run.
Each video explains the industry-specific digital thread challenges, solution approach, and business outcomes. All figures and data shown are illustrative. Twin data is simulated; twins send events and summaries to the thread, not raw streams.
Product Studio
Design · Build · Operate
One product, three lenses. Open a machine in 3D, read its structure from the Digital Thread, watch it being assembled the way the Factory Twin sequences it, then put it to work as the Field Asset Twin sees it.
Digital TwinSee this same machine on the assembly lineThis 22 t excavator is the model that moves through Main Assembly in the Manufacturing Digital Twin (Factory Twin): undercarriage and deck on arrival, then engine, hydraulics, cab and final assembly, station by station, with the cranes and bays that make it possible.
Pre-built Domain Focussed Digital Thread for Manufacturing
Our digital threads are not just blueprints — they provide industry-specific, demonstrable, and working concepts that significantly provide a jump-start to your Digital Thread journey across the product lifecycle.
What's inside a Digital Thread?
Each packages domain knowledge, reference architectures, and data models, into a repeatable framework. Built on deep industry experience, they reduce risk and accelerate delivery.
Industry-Specific Data Model Foundation
A unified schema that anchors every product, process and asset record — the same across domains.
Business Rules
Governance logic encoded once and applied consistently across every domain and every interaction.
Associations with File System Data
MS Office files, images, PDFs, analysis documents and drawings — linked to the same thread.
Analytical Layer Cutting across Domains
A single analytical layer that slices across engineering, manufacturing, supply chain and service.
From Fragmented Data to Connected Intelligence
Request Industry Demo
See how our platform works for your industry.
Thank you! We'll reach out shortly.
Digital Thread is not an integration project — it's a business transformation
that connects value chain intelligence to every decision.
Key Features & Digital Thread Linkages
A connected view of every capability and every domain the thread touches — from requirements
and engineering structures to supply chain, manufacturing, field service and market insight.
Key Features
End-to-End Digital Thread
Connect the complete product value chain.
Product Family & Portfolio
Platforms, variants and options on one connected record.
Market Insights & Idea Management
Voice of market and customer feeding the idea funnel.
Impact & What-if Analysis
Visualize the consequences of change.
AI Decision Intelligence
Turn lifecycle context into actionable decisions.
Value Cockpit
Quantify value, leakage, risk and opportunities.
Governance & Compliance
Maintain auditable lifecycle traceability.
Digital Thread Linkages
Navigate relationships across the product lifecycle.
EBOM / MBOM / SBOM
Connect engineering, manufacturing and service structures.
Requirements Traceability
Trace requirements through product and verification.
Engineering Change Intelligence
Understand the full downstream impact of change.
Supply Chain Risk Intelligence
Connect supplier risks to products, orders and production.
Connected Manufacturing & Quality
Link production, materials, processes and quality.
Inquiry-to-Order & Configure-to-Order
From customer inquiry to a confirmed, traceable order.
Field-to-Engineering Feedback
Close the loop from asset experience to product improvement.
Digital Twins: Factory & Field Asset
Plant OEE and capacity, and fleet health, alarms and usage, flow both ways with the Thread and are routed to Service and Engineering.
Capability is demonstrated end-to-end on the digital thread,
traceable from a single part to the full value chain.
Where-Used / Referenced across Value Chain
Digital Thread Linkages · Where-Used across Value Chain
Five business questions here. Five working answers. And Several More...
Each row shows the platform answering a real value-chain question —
with the operational evidence that produced it. No slideware. Numbers below are illustrative.
Question 01 · Change
What if we change this part?
Release ECN-1004 (Track Chain hardness revision) and it
immediately shows everything touched — the governing requirement, the EBOM part,
the affected work order WO-3002, the open purchase order PO-5004,
the supplier SUP-006, and BHP's open MT700 order. Three transition
scenarios are priced side by side.
1 requirement 1 EBOM part 1 work order 1 PO · 1 supplier 1 customer order 1 fleet
Before you release a change, see every requirement, work order,
purchase order, customer order and serialized asset it touches — and compare
transition scenarios side by side to pick the least disruptive path.
Operational signal in the thread is valued — ECN exposure, NCR rework,
supplier risk, open complaints, energy — and rolled up into a single executive
view: potential, addressable, realized, and value at risk. Every dollar traces
back to the record that produced it.
Turn thread connectivity into board-ready numbers — and trace every
one of them back to the operational record that produced it. No BI extract, no
reconciliation, no second source of truth.
Value Cockpit · Construction Equipment
Potential
$17.9M
Gross opportunity pool
Addressable
$12.9M
72% of potential
Realized
$6.2M
48% of addressable
At Risk
$4.2M
Signals to address
Where value is leaking
🔧 Engineering changes → inventory exposure$5.7M
🏭 Quality → manufacturing rework$1.3M
📦 Supplier risk → delivery exposure$1.8M
🚜 Field issues → warranty / service$4.7M
Question 03 · Closed Loop
How does the field change the next design?
A field complaint on an SSL250 becomes a manufacturing NCR, which becomes an
engineering change, which becomes a next-production and fleet update. The
thread carries the signal across all four — and hands the Product Manager
an AI Advisor summary with the exact recommendation to act on.
SC-005 · field signal NCR-001 · root cause ECN · software Next production + fleet
Close the loop. Every deployed asset becomes a design input —
not a spreadsheet entry. It turns field experience into
engineering action, and engineering action back into fleet update.
Field → Engineering · SSL250 high-flow response
Signal travels back to design
🚜
SC-005
SSL250 · field signal High-flow delay
→
🔧
NCR-001
High-flow attachment kit non-conformance
→
📝
ECN · Software
Hydraulic response software update
→
✨
Next Gen
Future production + existing fleet
↻ Loop closes · field learning feeds the next design and the deployed fleet
🧠 AI Advisor · Product Manager
Accelerate SSL250 high-flow software rollout to 14 serialized assets across 11 countries.
Prioritize dual-sourcing for the high-flow attachment kit to prevent recurrence.
Question 04 · Intelligence
Who in my organization uses this — and what do they see?
The same thread reshapes itself per role. The COO sees value-chain health and bottlenecks.
The CCB sees change impact, obsolescence and compliance. The Product Manager
sees AI recommendations grounded in real field signal. No IT dashboard, no configuration
exercise — the thread already knows who each person is and what they own.
One thread. Many roles. Every role gets its own evidence-backed answer —
not a dashboard configured by IT, and not a report that takes a week to produce.
AI Advisor · Role-based intelligence from the same thread
Same data · three different views
🏢 COO
68%
Value-Chain Health · Caution 3 bottlenecks · 2 high-risk
📈 CCB
4 ranked
Changes · 2 immediate 1 non-compliant part
📦 Product Mgr.
2 AI recs
Field-grounded next-gen priorities
🧠 AI Advisor · current recommendations
Accelerate SSL250 high-flow software rollout to 14 serialized assets across 11 countries.
Prioritize dual-sourcing for high-flow attachment kit to prevent recurrence.
Question 05 · Compliance
Can we prove compliance — for every requirement, every machine?
Pick any governed requirement and the thread shows the entire proof chain in one view:
the control domain it belongs to, the requirement text, the EBOM part that implements it,
the MPM operation that builds it, the V&V or Quality evidence that verifies it, and
every serialized asset that carries it in the field.
6 control domains 30 controlled requirements evidence-backed fleet-wide passport
Compliance isn't a report — it's the thread itself. Every claim traces
to a requirement, a part, a process, a test, and a serial number. No separate audit
database, no reconciliation, no auditor's checklist.
Governance · Compliance trace for EXC-200-401-003
One requirement · six-link proof chain
Control
Machine Safety
GOV-01
→
Requirement
EXC-200-401-003
Track chain life ≥6,000 hrs
→
EBOM
Track Chain
600 mm shoes
→
MPM
OP-030
Undercarriage assembly
→
Evidence
Pass
WO-3001 · OP-080
→
Field Asset
EMX220-24011
SW 4.2.1 · FW 3.8.0
Governance KPIs (live)
Controlled
30
Compliant
26
At Risk
3
Gaps
1
Assets
14
Experience the Digital Thread
Watch a short guided walkthrough, or dive into a live interactive teaser — or request access to the sandbox and try it yourself. See how Digital Thread for Product Development works in a seamless manner with data populated from underlying Enterprise systems like PPM, PLM, ERP, MES, IIOT, etc.
Built for coursework and research. Get hands-on with the same digital thread framework used in industry — trace requirements, explore BOM structures, and see how field data feeds back into design. No installation, no setup, works in your browser.
Bring the digital thread into the classroom. A ready-to-use sandbox with pre-loaded datasets, role-based views, and guided scenarios — so students can explore industrial product data without enterprise setup or licensing complexity.
Evaluate the digital thread on real scenarios. Walk through the full value chain — change impact, value cockpit, field-to-engineering loop, AI advisor, compliance trace — and see where it fits your product lifecycle. No slideware: every capability is demonstrable.
Digital Thread · Guided Walkthrough 3:06
What you'll see
Five moments that show the digital thread end-to-end
What's inside the sandbox
Everything runs in your browser — no installation required
Pre-loaded dataset
A realistic construction equipment product with its full value chain already threaded.
360 Degree Linkages
Parts & Assembly links (Where-Used/ Referenced) to other data entities
Impact & What-if engine
Release a change and price the downstream effect across variants and the fleet.
Field signal simulator
Inject a field complaint and watch it travel back to design as an NCR and ECN.
AI Advisor console
See the recommendations a role-based advisor surfaces from the same thread.
Value Cockpit
Quantify potential, addressable, realized, and at-risk value across the thread.
In 2 HRS, you'll have:
Traced a requirement end-to-end across the value chain
Reviewed a change and visualized its impact
Reviewed a field signal and closed the engineering loop
Request Academia Trial Access
Fill in your details and we'll get in touch with you to get you setup.
Sandbox access for limited duration based on objective provided in Request Form
Pre-loaded dataset & guided scenarios
No installation — runs in your browser
What happens next
We review your submission and reach out to you.
You receive a personalized trial link and a brief starter guide.
You explore at your own pace — reach out any time for clarifications.
Request Trial Access for Educational Institutes
Thank you! We'll send your trial access details shortly.
Prefer to read? Open the guided tour transcript
This guided walkthrough begins with a single product record — the Earthmover —
and shows how its information is fragmented across five systems before the platform threads
them into one view. From there, the tour traces the value chain end-to-end: from the original
idea through requirements, engineering and manufacturing BOMs, work orders, and into the field.
It then visualizes an engineering change and shows every requirement, purchase order,
customer order, and serialized asset the change touches — with three transition scenarios priced
side by side. Next, a field complaint is carried back through an NCR and an ECN,
closing the loop into the next production and the deployed fleet. Finally, the tour opens the
sandbox — the same environment you'll receive when your trial request is approved.
See how a Factory Twin and the Digital Thread exchange plans and measured results, so dates are committed on real capacity.
Factory Twin · Guided Walkthrough1:32
What you'll see
The plant and the Thread, in step
What you'll see
From a machine in the field back to the design
Shown with an earthmoving reference plant and a simulated fleet; plant and fleet data are simulated.
Try it — a Quick guided walkthrough
Click through five connected views of a real Digital Thread. Only a few nodes are
interactive — the rest of the platform stays locked.
CE
Construction Equipment · Digital ThreadEarthmoving & Building
Guided tour · start by expanding Medium Excavators5 of 24 modules unlocked
Knowledge Hub · Explore · Learn · Experiment
Turn Digital Thread knowledge into product value chain intelligence.
Explore practical frameworks, interactive tools, industry domains and learning labs
that connect product data to better engineering decisions, measurable value and
closed-loop improvement.
Start with your goal
One hub. Three ways to engage.
Use the same Digital Thread foundation from different perspectives — learning the concepts,
applying them at work, or exploring research questions.
Manufacturing Co. Professional/ Practitioner
Assess readiness, prioritize use cases, quantify value and explore how connected product information supports real decisions.
Educator / Student
Build Digital Thread literacy through guided walkthroughs, hands-on product structures, labs, assignments and industry challenges.
Researcher
Explore reference models, research questions, datasets and experiments spanning AI, sustainability, Digital Twins and lifecycle feedback.
A connected experience
From insight to experiment — and back to knowledge.
Every resource should guide the visitor to a next step, not leave them at a standalone article or calculator.
01 · ASSESS
Understand readiness
Establish a baseline and surface capability gaps.
02 · LEARN
Explore a framework
Read the concept most relevant to the gap.
03 · SEE
View an industry story
Ground the idea in a real product lifecycle.
04 · EXPERIMENT
Try the sandbox
Trace objects, simulate change or close a loop.
05 · QUANTIFY
Build the value case
Connect the opportunity to measurable outcomes.
06 · APPLY
Plan next steps
Identify a pilot, research question or learning lab.
Interactive, self-serve utilities to size the opportunity, shape the business case and
move the digital thread conversation from concept to numbers. Work them in order —
each one sharpens the next.
1
Digital Thread Readiness Assessment
Twenty-five questions across ten dimensions. Establish where your organisation actually stands today — and which foundational gaps to close before anything else is built on top.
Diagnostic
then
2
Digital Thread Use Cases Prioritization
Score and rank candidate use cases against business value, data readiness, feasibility and time-to-value — so the shortlist is defensible in front of a steering committee, not argued about in one.
Prioritisation
then
3
ROI Calculator for Digital Thread
Build a 5-year business case for your digital thread program — turnover-scaled value capture, users by functional area, investments across five cost heads, and the resulting ROI, NPV, IRR and breakeven year.
Business Case
Proposed toolkit architecture
The current assessment, prioritization and ROI tools are live. Additional tools —
Use Case Explorer, Reference Architecture Builder, Information Model Explorer, Digital Thread
Sandbox, Change Impact Simulator, Carbon & Sustainability Decisions, and Engineering AI Use-Case
Explorer — are introduced in phases aligned with the Industry Labs roadmap.
Knowledge library
Explore the ideas shaping Product Value Chain Intelligence.
Organize resources by the questions they help answer — from foundational architecture
to sustainability and measurable business value.
Why AI needs product context: connect evidence, reasoning and traceability to explainable engineering decisions and actions.
Digital Twins
Digital Twin & Closed-Loop Engineering
Connect design, manufacturing, operations and service feedback so field learning informs the next product decision.
Sustainability
Design for Sustainability
Move beyond reporting to engineering trade-offs across product carbon footprint, materials, performance, reliability and manufacturability.
Decision intelligence
Engineering Change & Impact Intelligence
Answer "what happens if?" across requirements, EBOM, MBOM, work orders, suppliers, customers, installed assets and compliance.
Value
Product Value & Value Leakage
Connect engineering and operational signals to inventory, productivity, scrap, rework, warranty, working capital and realized benefits.
Industry playbooks
Industry Digital Thread Playbooks
See how the same lifecycle principles adapt to Earthmoving, Automotive, Power Generation, Industrial Engines, Consumer Products and Beverages.
Learning
Field-to-Design Loop
Connect field performance, service events, and customer feedback directly into engineering design decisions—closing the lifecycle loop from deployment back to concept.
Foundation
PPM, PLM, ERP, MES, Supply Chain, Services & IIOT
Understand the systems of record across the value chain — what each owns, how they connect, and where the data foundation for a Digital Thread begins.
Governance
Trust, Traceability & Compliance
Trace control, requirement, product structure, manufacturing process, evidence and serialized field asset in one connected thread.
Industry Digital Threads are the living laboratories.
Use working concepts to make abstract frameworks tangible. Start with Earthmoving as the
flagship demonstration, add the Factory and Field Asset Digital Twins, then extend the pattern to adjacent industries.
Digital Twins
One Digital Thread with a Factory Twin and a Field Asset Twin: plant results and field alarms, condition and usage come back, and are routed to Service and Engineering.
Explore product, software and system relationships across change, configuration, manufacturing and vehicle lifecycle decisions.
EBOM / SBOMSoftware contextChange impact
Power Generation
Connect turbine and generation assets to engineering, manufacturing, operational signals, compliance and lifecycle value.
Asset lifecycleGovernanceDigital Twins
Experience Digital Thread
Learn by following the thread
Explore Digital Thread through six complementary learning modes — starting with a real challenge, moving through the lifecycle and roles, and finishing with a comprehensive program you can adopt.
A progressive journey from guided learning to independent exploration
Start with a challenge — experience why connected information matters.
Follow the lifecycle — understand how information travels from idea to field.
Choose your role — see the same Digital Thread from different perspectives.
Use advanced capabilities — investigate, analyse impact and make decisions.
Explore freely — create your own questions and discover the thread.
Adopt the programme — take the whole thing into a Course Learning Pack.
01 PRIMARY LEARNING MODEL
Scenario / Challenge Based
Learn Digital Thread by solving a real manufacturing problem.
A structured, semester-ready way to teach and learn Digital Thread — with a faculty guide,
guided labs, a realistic industrial dataset and an assessment rubric already written.
L1
Foundation
Understand the thread
Learn what a Digital Thread is, how a product record is structured, and how to read the lifecycle end to end.
Define Digital Thread and distinguish it from an integration project.
Navigate Requirement, EBOM, MBOM, Asset and ECN records.
Trace a product from an idea to a deployed asset.
L2
Applied
Trace and analyse
Move from reading the thread to using it — change impact, closed-loop reasoning, supplier risk, evidence traceability.
Run an engineering change impact analysis across the value chain.
Follow a field failure back to a requirement and forward to a fleet.
Assess supplier risk and delivery exposure using connected data.
L3
Advanced
Design and defend
Design a thread for a new product and defend it in front of a review board.
Design a governance and compliance traceability model.
Quantify Digital Thread business value with documented assumptions.
Deliver a capstone thread definition for a chosen product.
Research & collaboration
Turn industry questions into researchable problems.
Make the hub useful for academic collaboration as well as practitioner adoption,
with clearly framed problems and tangible artifacts.
Research themes
Core domains where Digital Thread capabilities create new engineering questions.
Context-grounded AI for engineering
Dynamic product carbon footprint
Digital Twin lifecycle feedback
Change impact and decision intelligence
Research questions & datasets
Help students and researchers move from broad interests to testable questions.
How should lifecycle evidence be linked?
What makes an AI recommendation explainable?
How can design choices update PCF estimates?
What synthetic / industry data is needed?
Thesis & industry challenges
Connect academic work to demonstrable outputs and industry-relevant outcomes.
Predict downstream change impact
Close field-to-engineering feedback
Optimize cost, carbon and performance
Quantify Digital Thread business value
Your next step
Start with a question. Leave with a path to action.
Assess your readiness, explore an industry scenario, or use the learning and research pathways to frame your next Digital Thread initiative.
Industry Digital Thread Overview
~2 min overview · Click to play
Digital Thread Use Cases Prioritization
Score, rank and defend your digital thread shortlist · value · strategic fit · execution readiness
Assessment PurposePrioritize Digital Thread use cases
Scoring ApproachValue + strategic fit + execution readiness
Five-point evidence scale
Use the same scale consistently across all use cases. Score what is known today using the criteria shown below. All score fields are dropdowns restricted to 1 – 5 only.
1Very Low limited evidence
2Low early opportunity
3Moderate credible opportunity
4High strong evidence
5Very High compelling evidence
Suggestion: Use a cross-functional team from business, engineering, IT/data and operations. This calculator structures the discussion; it does not replace a detailed business case, architecture assessment or pilot validation.
Digital Thread use cases
Starter portfolio · select & score
The starter portfolio covers common PLM, ERP, MES, service, IoT and sustainability scenarios. Select the use cases you want to prioritize, then score each selected use case consistently. Use the dropdown in each cell — only values 1, 2, 3, 4, 5 are accepted.
Score the use cases and click Calculate Priorities.
Calculations & Methodology
The customer provides seven 1–5 inputs for each selected use case. The Results page condenses those inputs into five decision dimensions: Impact, Strategic, Customer / Sustainability, Readiness and Risk. The first three are direct inputs; Readiness is derived from three readiness inputs; Risk is the direct Delivery / Change Risk input.
Direct mapping. The entered Business Impact score is shown as Impact in Results.
Strategic
Strategic Alignment (1–5)
Direct mapping. The entered Strategic Alignment score is shown as Strategic in Results.
Customer / Sustainability
Customer / Sustainability Impact (1–5)
Direct mapping. The entered Customer / Sustainability Impact score is shown under this Results header.
Readiness
Data Availability, Technology / Integration Readiness, Process / Ownership Readiness
Derived: (Data Availability + Technology / Integration Readiness + Process / Ownership Readiness) ÷ 3. Shown to one decimal place out of 5.
Risk
Delivery / Change Risk (1–5)
Direct mapping. Higher risk reduces the overall priority score.
Seven input criteria and weights
Customer input criterion
Weight
What it measures
Business Impact
30%
Potential measurable effect on cost, revenue, quality, productivity, working capital or service performance.
Strategic Alignment
20%
Fit with enterprise strategy, transformation themes and Digital Thread objectives.
Customer / Sustainability Impact
10%
Potential customer experience, compliance, lifecycle, energy, carbon or circularity impact.
Data Availability
15%
Availability, accessibility and quality of information needed to execute the use case.
Technology / Integration Readiness
10%
Readiness of PLM, ERP, MES, CRM, IoT, analytics and integration capabilities.
Process / Ownership Readiness
10%
Process maturity, stakeholder ownership, operating model and ability to adopt the outcome.
Delivery / Change Risk
5%
Complexity, dependencies, organizational change and implementation uncertainty. Higher risk reduces the score.
Interpretation & disclaimer
A higher priority score reflects stronger expected value and/or stronger execution conditions under the selected weights. A lower score can indicate that foundational capabilities or dependencies should be addressed before the use case is scaled.
Disclaimer: The prioritization criteria, weights and bands are assessment conventions created for this calculator. They should be validated and calibrated with practitioners for industry / context-specific fine tuning.
DT
Digital Thread Readiness AssessmenttecTorrent · Tools
Self-service diagnostic
Where is your digital thread today?
Twenty-five questions, ten dimensions, about five minutes. It won't tell you anything you don't already suspect — but it will make you write it down, and that's usually where the useful part starts.
25 questions · 10 dimensions · about 5 minutes
Before you start
Rate where you actually are today. If you're torn between two scores, take the lower one. Optimistic answers make the whole exercise useless.
Five-point evidence scale
Score
State
What it means
1
Ad hoc
Manual. Held together by a few people who know how it really works. Nothing formally written down.
2
Emerging
There's a process, but it varies by team. Some integrations exist; coverage is patchy.
3
Defined
For the areas that matter, there's an actual process. Someone owns it. The data structures are documented.
4
Connected
A change in engineering shows up in manufacturing. A field issue shows up in design. People actually use this to make decisions.
5
Adaptive
The data is good enough to trust for simulation and AI. Someone's measuring how it improves. It's not a project anymore — it's how the place runs.
0 / 25 answered about 5 minutes
Your results will appear here
Finish the assessment and you'll get a maturity profile, a priority list, and a suggested next step.
How this is calculated
This is a tecTorrent model, built from patterns we've seen across manufacturing programs. It's not a certification, and it's not a benchmark.
Two things to say plainly. The weights below aren't sacred — they reflect what we've seen matter in the field, and they'll shift as more data comes in. And this isn't a certification or an industry benchmark. If someone offers you an "ISO-aligned maturity score," ask them what that actually means.
Patterns we see
Companies that score well on Data but poorly on Closed-Loop usually have a solid PLM implementation that never reached the service organization. The data's good; the loop isn't closed.
Companies that score well on Strategy but poorly on Governance have executive buy-in and no measurement discipline. The sponsor is engaged; nobody's tracking whether anything improves.
The most common profile we see is a strong Data / Systems core with a broken Closed-Loop. That's why field-to-engineering almost always shows up in the top three opportunities — it's not a rare problem, it's the standard one.
1 · Dimension score
Each dimension contains two or three questions. The dimension score is the arithmetic mean of the responses within that dimension:
Dimension Score = Sum of responses ÷ Number of questions in the dimension
It's normalized to a 0–100 scale for presentation:
Dimension % = ((Dimension Score − 1) ÷ 4) × 100
2 · Overall maturity score
Weights reflect how much each dimension typically matters for a usable Digital Thread — not how easy each one is to fix.
Dimension
Weight
Why it gets that weight
Strategy & Business Alignment
10%
If the thread isn't tied to numbers a CFO would recognize, it becomes a technology project.
Product & Lifecycle Processes
10%
Connects lifecycle activities instead of isolated applications.
Product Information & Data
12%
The foundation. Everything downstream inherits its quality — or its problems.
Systems & Integration
10%
Connects PLM, ERP, MES, QMS, CRM, IoT, and service — where they need it.
Traceability & Linkages
12%
This is the thread itself. Without it, the rest is just plumbing.
Governance & Data Quality
10%
Ownership, semantics, quality, access, and evidence. Usually the quiet failure mode.
Analytics, AI & Decision Intelligence
8%
Whether connected context supports real decisions — or just prettier reports.
Closed-Loop / Field Feedback
10%
Where most organizations have the biggest gap. Field signals rarely reach design cleanly.
People, Skills & Adoption
8%
Because every failed program we've seen was, in the end, a people problem.
Sustainability & Lifecycle Impact
10%
Whether lifecycle and environmental impacts can be tied to product decisions.
Overall % = Σ (Dimension % × Dimension Weight)
3 · Maturity bands
Overall score
Level
What it looks like in practice
0–20
Initial
Fragmented. Depends on manual coordination and a few people who happen to know how things work.
21–40
Emerging
Point capabilities exist. Cross-domain consistency isn't there yet. Most organizations sit here.
41–60
Defined
Important processes and information structures are in place. The foundation is real but not yet exploited.
61–80
Connected
Cross-system traceability is actually used to run the business — not just to report on it.
81–100
Intelligent / Adaptive
Connected, governed lifecycle data is in continuous use — for decisions, simulation, and improvement. Rare.
4 · How recommendations are chosen
Recommendations come from the lowest-scoring dimensions first. We also flag a foundation gap if any of the four foundational dimensions — Product Information, Systems & Integration, Traceability, or Governance — scores below 40%.
Why that matters: our experience is that most programs that stall on AI, analytics, or advanced scenarios didn't fail because of the AI. They failed because the foundation underneath wasn't ready, and the advanced work was layered on top of the gap.
Foundation gap
Fix the information model, identifiers, system relationships, ownership, or traceability first. Scaling AI on top of a broken foundation multiplies the mess.
Acceleration opportunity
If the foundation is ≥60% but Analytics/AI or Closed-Loop is weaker, this is where the marginal dollar earns the most. Decision intelligence, impact analysis, and field feedback are usually the fastest wins.
Access this document
Please share a few details to download the resource.
—PDF document
Resource
Thank you!
Your details have been received. You can now download the document.
5-year horizon · Year 0 = implementation year · benefits accrue Year 1 onwards
Company Profile
$M
Financial Assumptions
%
%
%
Productivity Savings — Users of Digital Thread
190 users
Headcount by functional area, with the annual productivity saving expected per user.
Turnover-linked Value Capture
annual, at full realization
Enterprise-level value unlocked by the digital thread beyond individual productivity —
expressed as a percentage of annual turnover.
Total Value Capture—
Cost Build seeded from total user count & turnover
Software LicenseYear 1 (full) · Year 0 at 10%—
Software AMCEach year from Year 2—
Digital Thread Implementation ServicesYear 0—
Server / InfrastructureYear 0 (one-time)—
Server / Infrastructure AMCEach year from Year 1 · 15% of original—
Total 5-Year InvestmentYear 0 through Year 5—
Business Case Outcomes
ROI (5-Year)
—
Net benefit ÷ total investment
NPV
—
Discounted at 10%
IRR
—
5-year net cash flow
Breakeven
—
Cumulative cash flow turns positive
Annual Net Cash Flow
Y0 is the implementation year · benefits begin in Y1
Cumulative Net Cash Flow & Breakeven
Breakeven is the point where cumulative cash flow crosses zero
Year-by-Year Business Case Year 0 → Year 5
Annual Savings at Full Realization productivity + value capture
How this model works. Year 0 is the year in which implementation completes — it carries the
Digital Thread Implementation Services, the Server/Infrastructure one-time outlay, and an initial Software
License at 10% of the Year 1 cost. The full Software License is incurred in Year 1. Software AMC applies
from Year 2 onwards, and Server/Infrastructure AMC (15% of the original infrastructure investment)
applies from Year 1 onwards. Productivity savings are derived from the user count and the annual saving
per user you set for each functional area. Value capture savings are turnover-linked: the percentage you
set for each driver is applied to annual turnover. Both benefit streams are ramped in Year 1 and Year 2
before reaching full realization. ROI = 5-year net benefit ÷ total investment; NPV discounts the net
cash flow at your chosen rate with Year 0 undiscounted; IRR is the discount rate at which NPV equals
zero; breakeven is the year in which cumulative net cash flow turns positive.